Philadelphia – Recent research by Qlik shows that enterprises are planning significant investments in technologies that enhance data fabrics to enable generative AI success, and are looking to a hybrid approach that incorporates generative AI with traditional AI to scale its impact across their organizations.
The “Generative AI Benchmark Report”, executed in August 2023 by Enterprise Technology Research (ETR) on behalf of Qlik, surveyed 200 C-Level executives, VPs, and Directors from Global 2000 firms across multiple industries. The survey explores how leaders are leveraging the generative AI tools they purchased, lessons learned, and where they are focusing to maximize their generative AI investments.
“Generative AI’s potential has ignited a wave of investment and interest both in discreet generative AI tools, and in technologies that help organizations manage risk, embrace complexity and scale generative AI and traditional AI for impact,” said James Fisher, Chief Strategy Officer at Qlik. “Our Generative AI Benchmark report clearly shows leading organizations understand that these tools must be supported by a trusted data foundation. That data foundation fuels the insights and advanced use cases where the power of generative AI and traditional AI together come to life.”
The report found that while the initial excitement of what generative AI can deliver remains, leaders understand they need to surround these tools with the right data strategies and technologies to fully realize their transformative potential. And while many are forging ahead with generative AI to alleviate competitive pressures and gain efficiencies, they are also looking for guidance on where to start and how to move forward quickly while keeping an eye on risk and governance issues.
Creating Value from Generative AI
Even with the market focus on generative AI, respondents noted they clearly see traditional AI still bringing ongoing value in areas like predictive analytics. Where they expect generative AI to help is in extending the power of AI beyond data scientists or engineers, opening up AI capabilities to a larger population. Leaders expect this approach will help them scale the ability to unlock deeper insights and find new, creative ways to solve problems much faster.
This vision of what’s possible with generative AI has driven an incredible level of investment. 79% of respondents have either purchased generative AI tools or invested in generative AI projects, and 31% say they plan to spend over $10 million on generative AI initiatives in the coming year. However, those investments run the risk of being siloed, since 44% of these organizations noted they lack a clear generative AI strategy.
Surrounding Generative AI with the Right Strategy and Support
When asked how they intend to approach generative AI, 68% said they plan to leverage public or open-source models refined with proprietary data, and 45% are considering building models from scratch with proprietary data.
Expertise in these areas is crucial to avoiding the widely reported data security, governance, bias and hallucination issues that can occur with generative AI. Respondents understand they need help, with 60% stating they plan to rely partially or fully on third-party expertise to close this gap.
Many organizations are also looking to data fabrics as a core part of their strategy to mitigate these issues. Respondents acknowledged their data fabrics either need upgrades or aren’t ready when it comes to generative AI. In fact, only 20% believe their data fabric is very/extremely well equipped to meet their needs for generative AI.
Given this, it’s no surprise that 73% expect to increase spend on technologies that support data fabrics. Part of that spend will need to focus on managing data volumes, since almost three quarters of respondents said they expect generative AI to increase the amount of data moved or managed on current analytics. The majority of respondents also noted that data quality, ML/AI tools, data governance, data integration and BI/Analytics all are important or very important areas to delivering a data fabric that enables generative AI success. Investments in these areas will help organizations remove some of the most common barriers to implementation per respondents, including regulation, data security and resources.
The Path to Generative AI Success – It’s All About the Data
While every organization’s AI strategy can and should be different, one fact remains the same: the best AI outcomes start with the best data. With the massive amount of data that needs to be curated, quality-assured, secured, and governed to support AI and construct useful generative AI models, a modern data fabric is essential. And once data is in place, the platform should deliver end-to-end, AI-enabled capabilities that help all users – regardless of skill level – get powerful insights with automation and assistance. Qlik enables customers to leverage AI in three critical ways:
- A trusted data foundation for AI – Qlik’s data integration and quality solutions leverage AI to automate data delivery and transformation, reducing complexity, mitigating risk, and enabling data fabrics.
- AI-enhanced and predictive analytics – Qlik has a long track record of delivering AI-enhanced and predictive analytics capabilities. Qlik’s OpenAI connectors extend the power of generative AI to Qlik analytics, bringing even more powerful chat capabilities to a rich user experience.
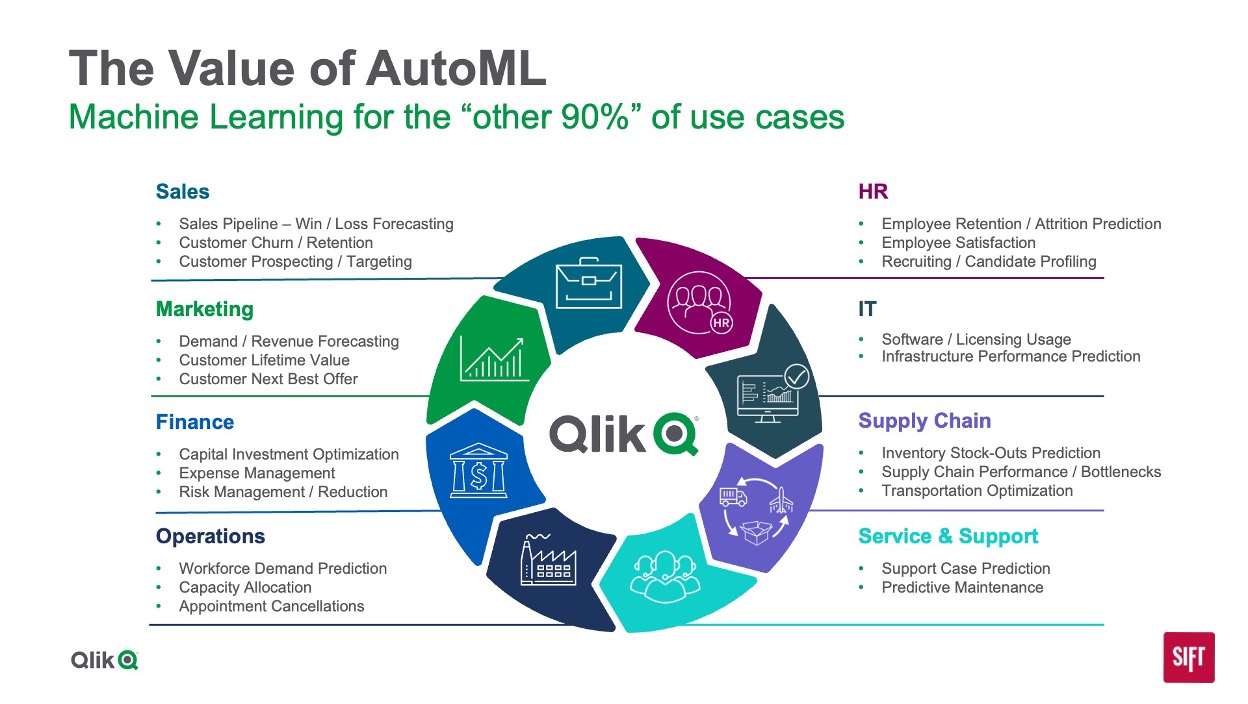
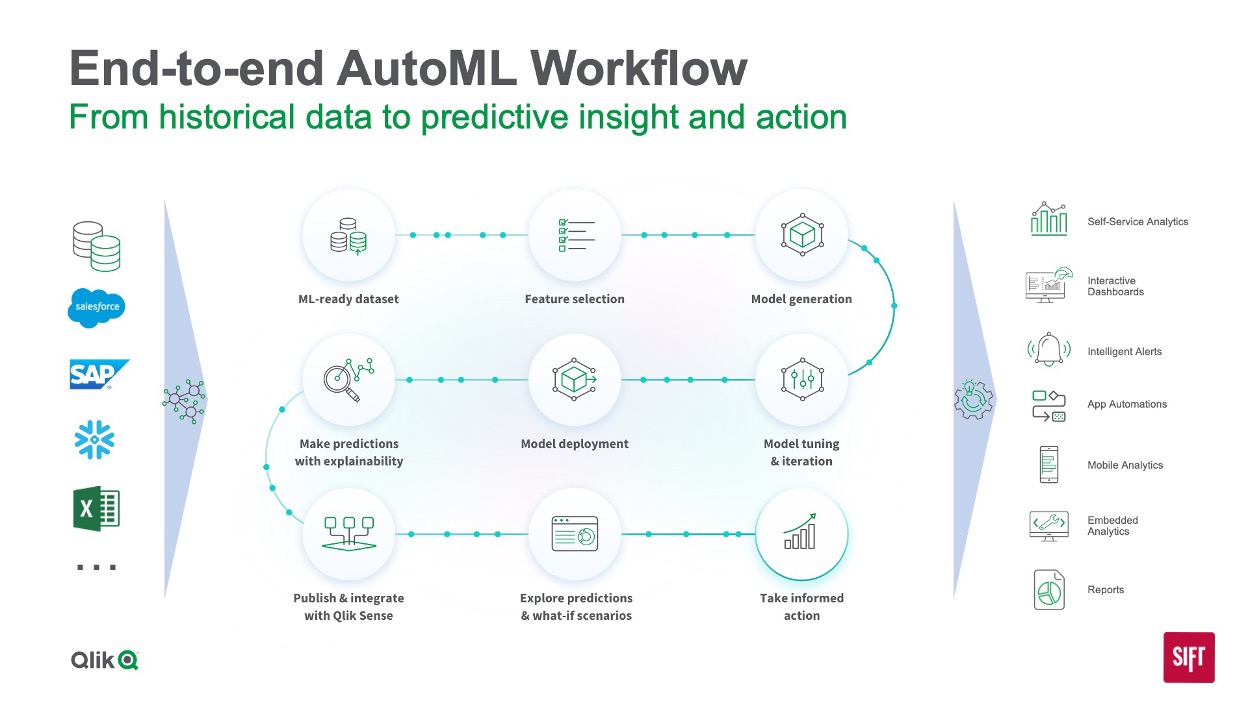
- AI for advanced use cases – Qlik AutoML™ helps organizations scale data science investments while enabling technically inclined staff to customize AI solutions for new use cases.
To learn more about how Qlik is helping organizations drive success with AI, visit Qlik Staige.